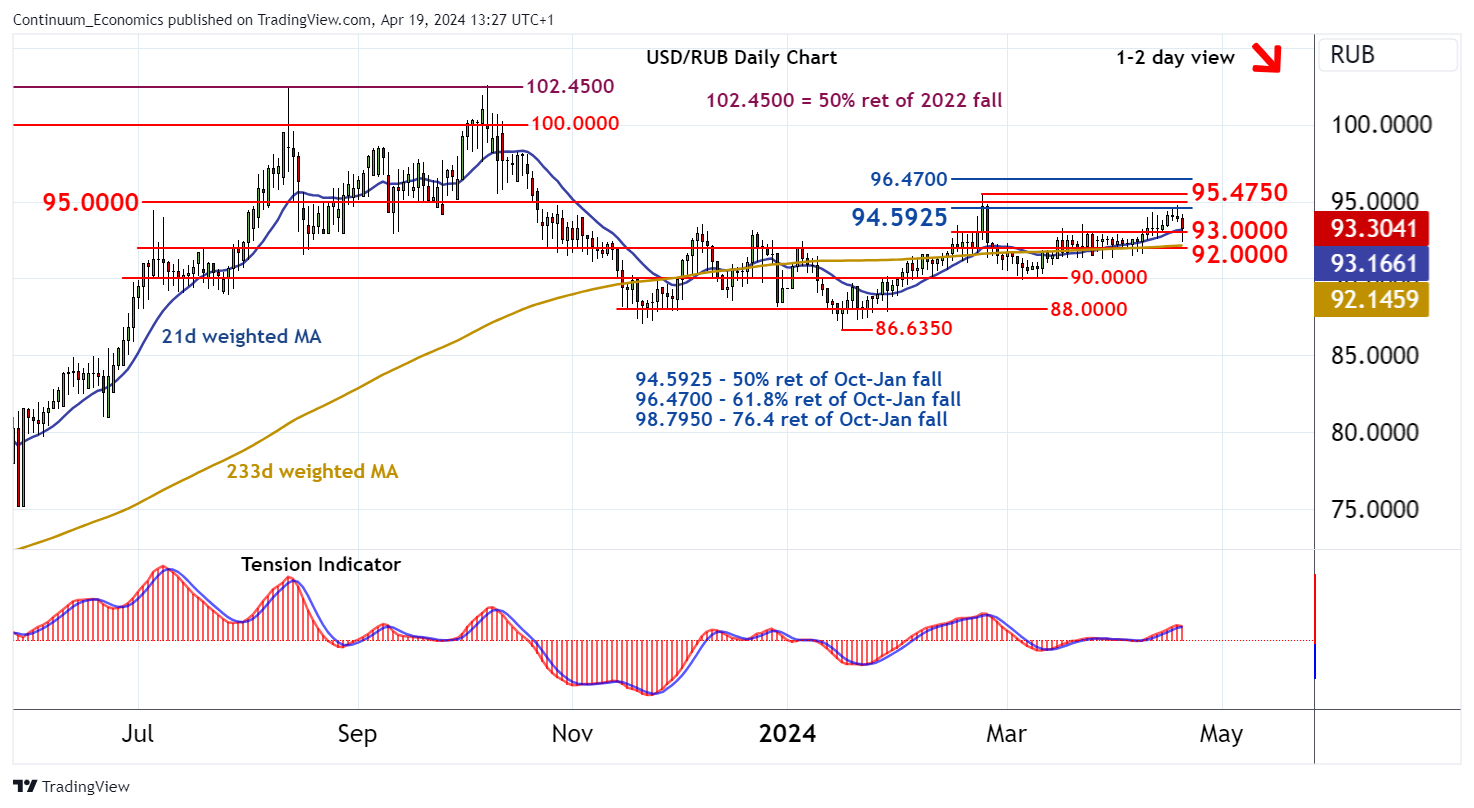
Chart USD/RUB Update: Choppy in range - studies leaning lower

The test of resistance at the 94.5925 Fibonacci retracement has not been sustained
| Levels | Comment | Levels | Comment | |||||
| R4 | 96.0000 | * | congestion | S1 | 93.0000 | * | congestion | |
| R3 | 95.4750 | * | 23 Feb YTD high | S2 | 92.0000 | * | congestion | |
| R2 | 95.0000 | ** | congestion | S3 | 90.0000 | * | congestion | |
| R1 | 94.5925 | ** | 50% ret of Oct-Jan fall | S4 | 88.0000 | * | congestion |
Asterisk denotes strength of level
13:10 BST - The test of resistance at the 94.5925 Fibonacci retracement has not been sustained, as overbought daily stochastics unwind and the bullish daily Tension Indicator flattens, with volatile trade testing below congestion support at 93.0000 before bouncing back above here. In the coming sessions, a fresh break is looked for, with focus to turn back to 92.0000. Risk is for a further test beneath here, but mixed/positive weekly charts should limit any deeper reactions in fresh consolidation above congestion support at 90.0000. Meanwhile, resistance remains up to the 95.4750 current year high of 23 February. A close above here would turn sentiment outright positive and extend January gains towards the 96.4700 retracement.