Chart USD/JPY Update: Choppy at 34-year highs - bullish daily under pressure

The test below support at 154.00 has bounced smartly from above the 153.38 weekly high of 12 April
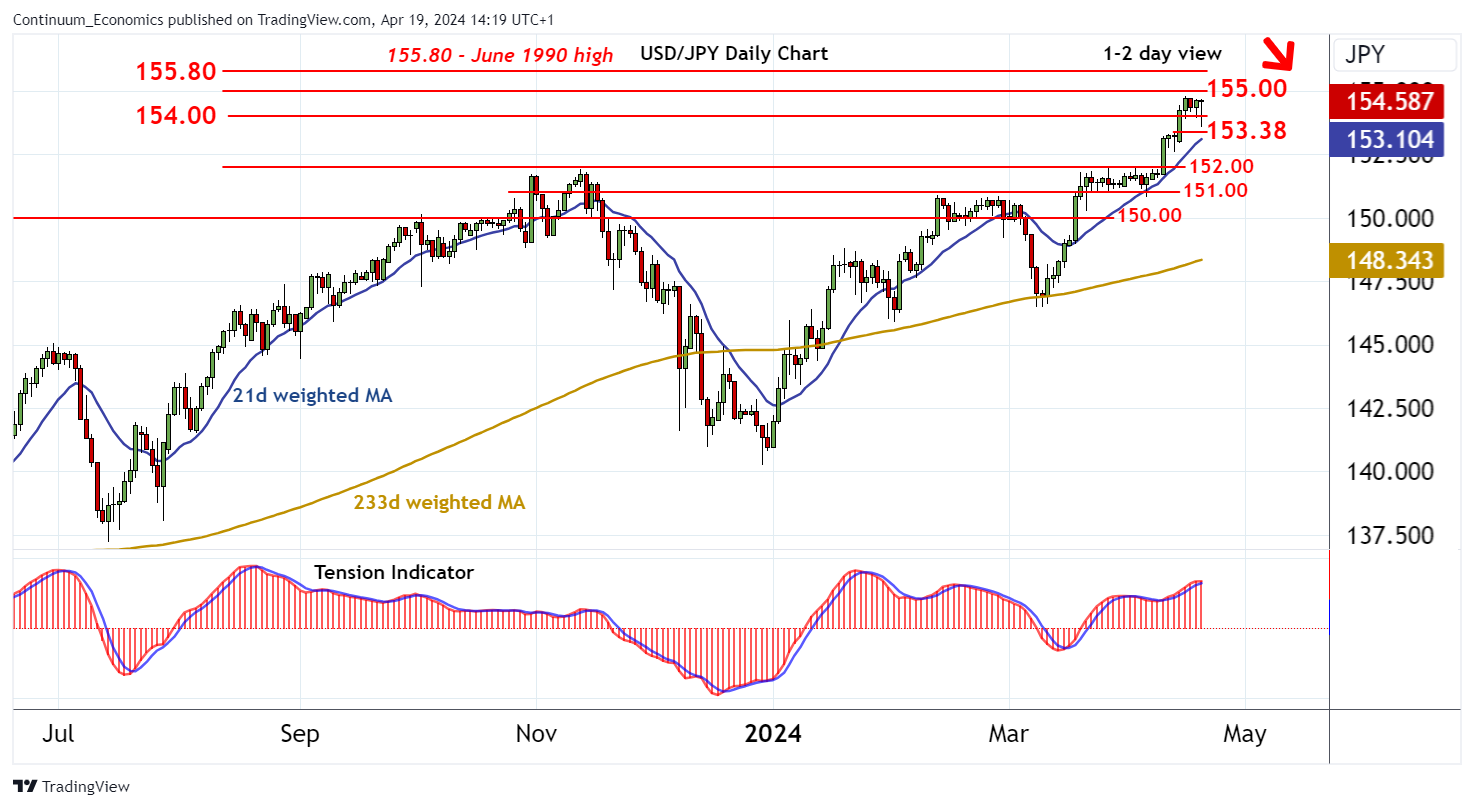
| Levels | Imp | Comment | Levels | Imp | Comment | |||
|---|---|---|---|---|---|---|---|---|
| R4 | 156.00 | figure | S1 | 154.00 | figure | |||
| R3 | 155.80 | ** | June 1990 high | S2 | 153.38 | * | 12 Apr (w) high | |
| R2 | 155.00 | * | figure | S3 | 152.00 | * | break level | |
| R1 | 154.79 | * | 16 Apr YTD high | S4 | 151.00 | * | congestion |
Asterisk denotes strength of level
14:05 BST - The test below support at 154.00 has bounced smartly from above the 153.38 weekly high of 12 April, as oversold intraday studies flatten, with prices once again balanced in cautious trade above 154.00. Overbought daily stochastics are unwinding and the rising daily Tension Indicator continues to flatten, suggesting room for a fresh pullback in the coming sessions. A break back below 154.00 will put focus back on 153.38. Further losses will open up 152.00, but rising weekly charts are expected to prompt fresh buying interest towards here. Meanwhile, resistance remains at the 154.79 current year high of 16 April and extends to 155.00. A break above here, if seen, will extend gains to the 155.80 high of June 1990, where already overbought weekly stochastics could promote profit-taking/consolidation.